The very first edition The Global Data Barometer Report has just been released. We are already getting some powerful insights into the future of open data through their many concrete examples, as well as realizing the opportunities for the development of open data.
About the Barometer
The Global Data Barometer is a project of the Data for Development Network (D4D.net) and builds upon the Open Data Barometer study between 2013 and 2020.
It was run by the Web Foundation and the Open Data for Development Network.
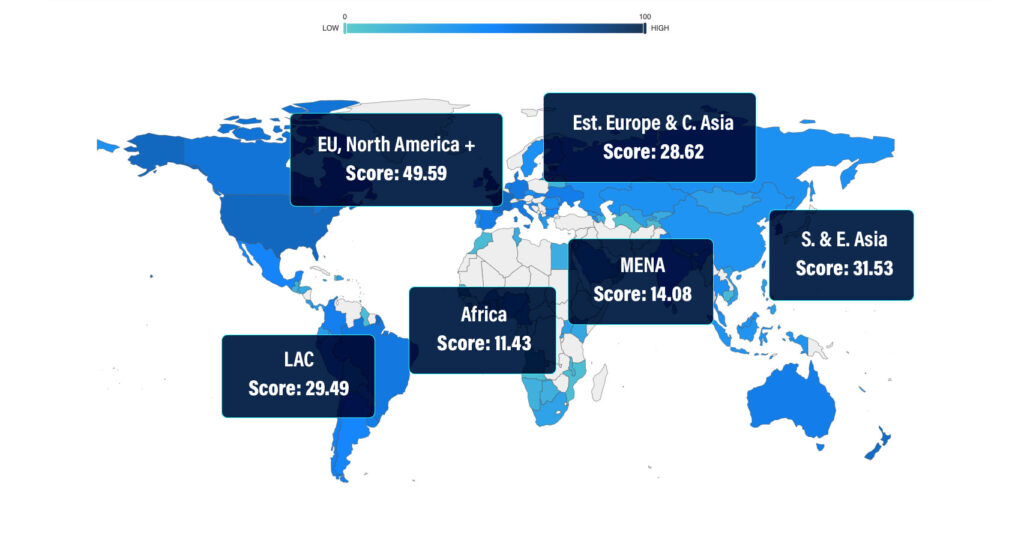
The first edition of the Global Data Barometer Report is based on data from a global expert survey conducted in mid-2021 that assessed the state of data for the public good in 109 countries.
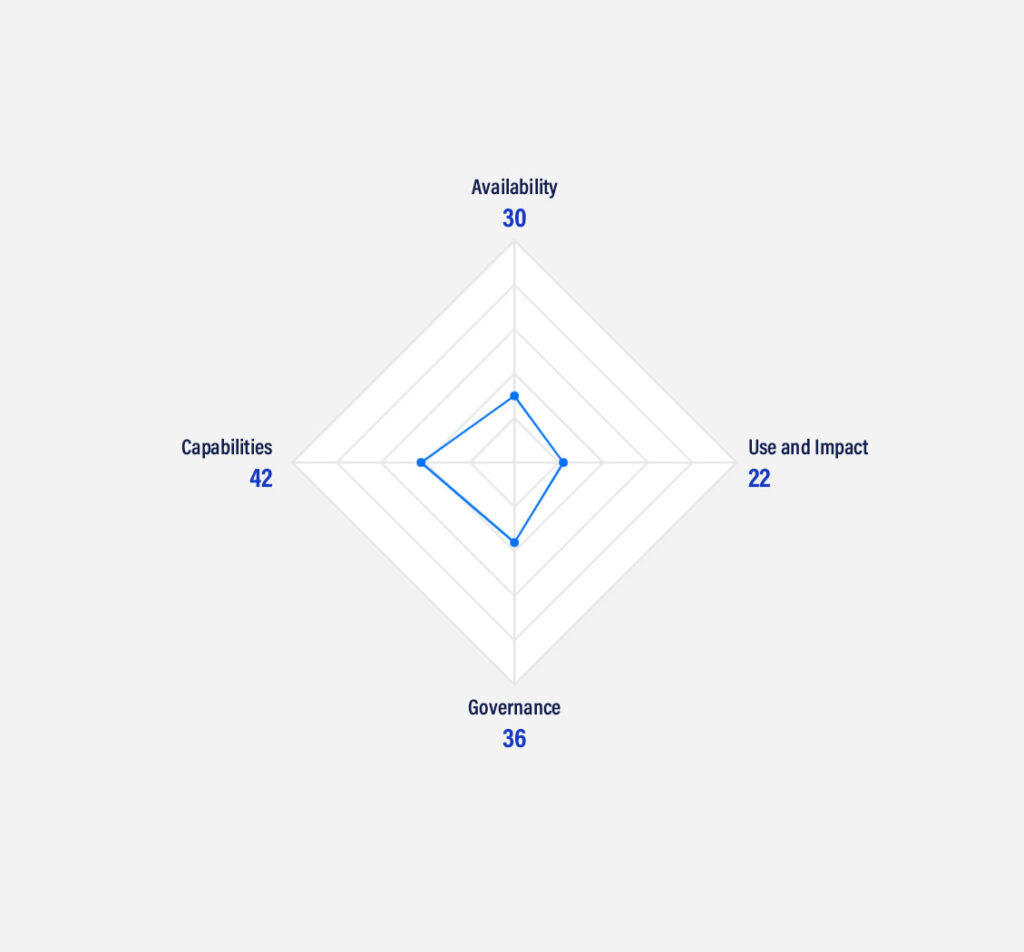
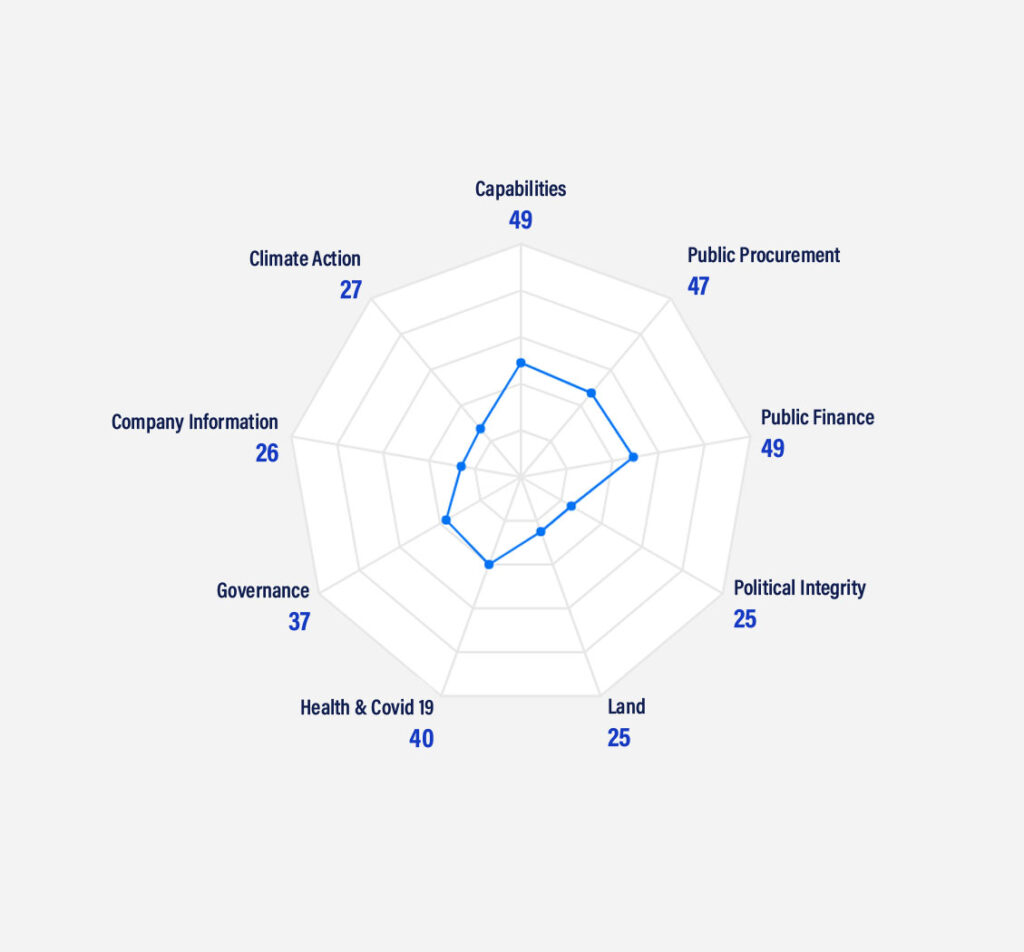
This first edition offers a new global benchmark that looks at data governance, capability, availability and impact of data for the public good. And explore topics like Climate action, Political integrity, and Public finance. It provides an overview of the development of a global data ecosystem and more broadly provides insights to shape the “data revolution”: offering critical comparisons, analysis and examples.
The 6 findings we keep
1. Open, but still not enough open
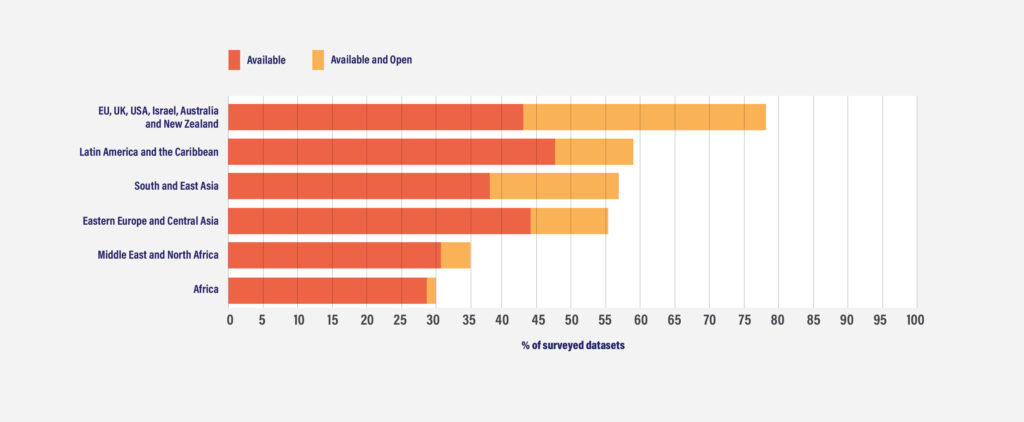
In 2016, the last global measure of the Open Data Barometer underlined that less than 20% of data was open (fully machine-readable, openly licensed, freely available and in bulk).
Since then, the proportion of datasets published as open data has remained relatively stagnant with 10.63% of datasets surveyed meeting the open definition.
Overall, more than half of the 315 open datasets identified came from the European Union, UK, North America, Israel, Australia and New Zealand region, whereas, just 11 of the 374 datasets checked in the Africa region were judged to be open data. The biggest limiting factor appears to be the lack of bulk data provision.
2. Let’s keep shaping data to deliver public good
It is possible to both govern data well and make it available and used for the public good. However, no individual country scored over 70%. This shows that every country has to work on updating policy, share data, and promote data use to make sure that data work as a resource for sustainable development.
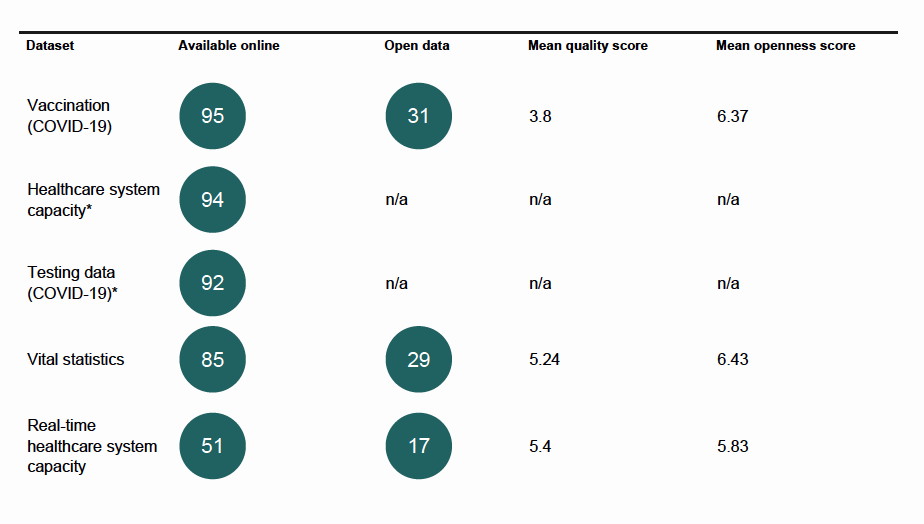
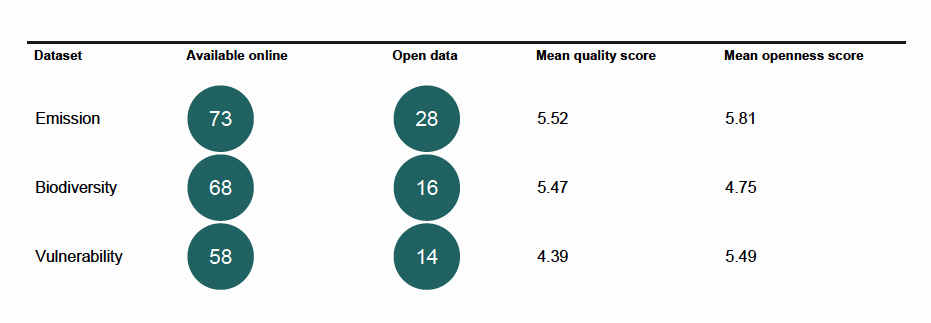
The Barometer indicators provide insights into how far data is being made available at the national level, highlighting some bright spots and some significant gaps. The challenge of making sure that data is available for meaningful re-use is well illustrated by data gaps around climate action and COVID-19:
3. Scale data culture (governance and data literacy)
Data management and open data policies are increasingly well-established, although far fewer countries have robust data frameworks to govern data-sharing, potentially creating gaps.
We can see that the lack of training in data management and the strengthening of teams within administrations risks undermining the production and governance of high-quality data. This also limits opportunities of ensuring reliable use of published open data.
There are significant opportunities to expand the range of topics covered by data-related training.
4. Structure is the key to delivering better data
Examining the gap between rules and data availability the report shows that when rules are explicit about data collection and sharing, data is more likely to be available, and open, to contain the data fields that matter.
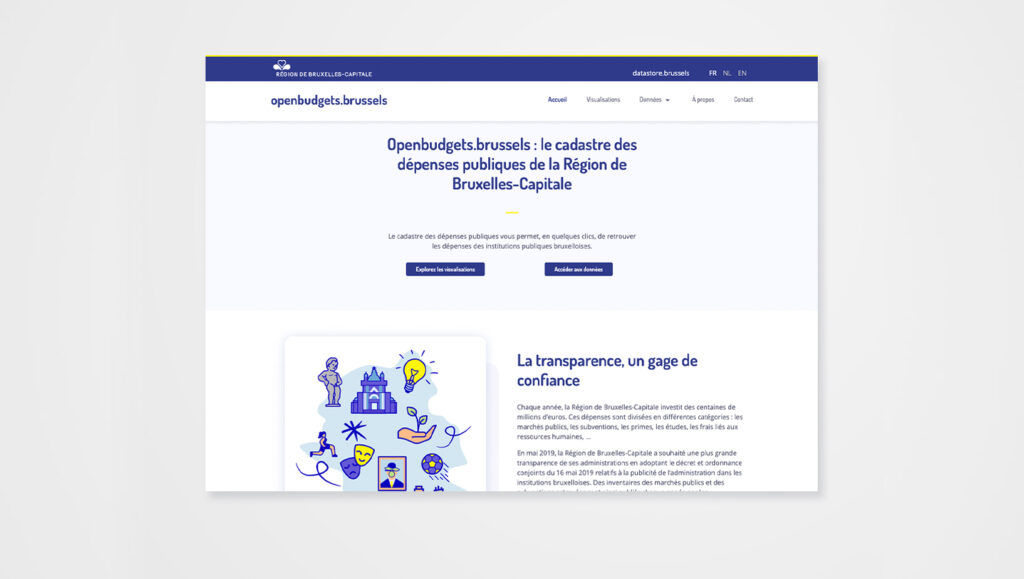
The Barometer highlighted the use of dashboards and red-flag analysis tool to procure data use.
A good example of a portal that offers the ability to search through public data is the Openbudget.brussels platform Cognizone created for publishing the cadaster of public spending in the framework of public procurement and grants in Brussels Region.
5. Partnerships are powering data use
Collaboration between traditional civil society and civic technologists, or between journalists and private sector application providers are driving new uses of data to highlight corruption, promote integrity, monitor environmental issues and shape policy debates.
Governments can promote more accountable data practice, by increasing the transparency in their use of data and making the public more aware of when they are collecting, sharing and using data.
6. Equity and Inclusion
Topics such as inclusion or equity among marginalized populations are rarely addressed in the use of data for the public good.
Using data for the public good could provide an opportunity for small communities or organizations to gather and participate in sensitive issues that directly concern them.
The use of data should meet the needs of everyone. There are many opportunities to improve and promote data use that is sensitive to the particular needs of marginalized populations.
Lesson learned
It is possible to create the conditions for data to contribute to the public good fairly easily, but according to the Barometer they are not guaranteed. Policy choices must explicitly aim at building capacity, institutions and infrastructure around data.
To ensure that individuals and communities are effectively protected against possible harms while critical datasets are reliably collected, managed, shared and published with the features that are needed for widespread, collaborative and high impact re-use.
An invitation to engagement and dialogue
The report contains interesting examples of workarounds and accommodations that users may employ for missing or unstructured data. It also underlines the fact that many barriers to effective data access and use continue to limit potential innovation and problem solving with data.
They identified a range of potential ways forward to close some of the gaps, from governments focusing more on the use of their own datasets and developing more robust data infrastructures, to increased partnership and collaborative working both around the supply and use of data.
Data. For good.
This means for us, that the challenges we have been facing for over 15 years have evolved but remain important. More than ever we are working toward more open and accessible data use.
Data. For good.
And we keep working collaboratively to advance society through open data and user empowerment.
The Global Data Barometer Report can be downloaded from the official website globaldatabarometer.org
The Global Data Barometer Report